Permutation test
The biological meaning of the extracted frequency is assessed by the probability that the frequency occurs by chance. We define a null hypothesis by shuffling a query position to estimate its probability distribution. That is, we randomly shift the query position many times (default=100, controlled by the -random option) and calculate the contact intensities. Finally, the query’s contact frequency is evaluated by its ranking among the sampled intensities. You can turn off shuffle test by -random 0.
We provide tools/visualPermutationTest.R, a script to visualize the query’s output against the random samples’ distribution.
hicmaptools -in_map fly_30k.n_contact -in_bin fly_30k.cbins -bait bait.bed -random 100 -output baitTest.tsv
Rscript tools/visualPermutationTest.R baitTest_random_1.txt baitTest_plot.pdf
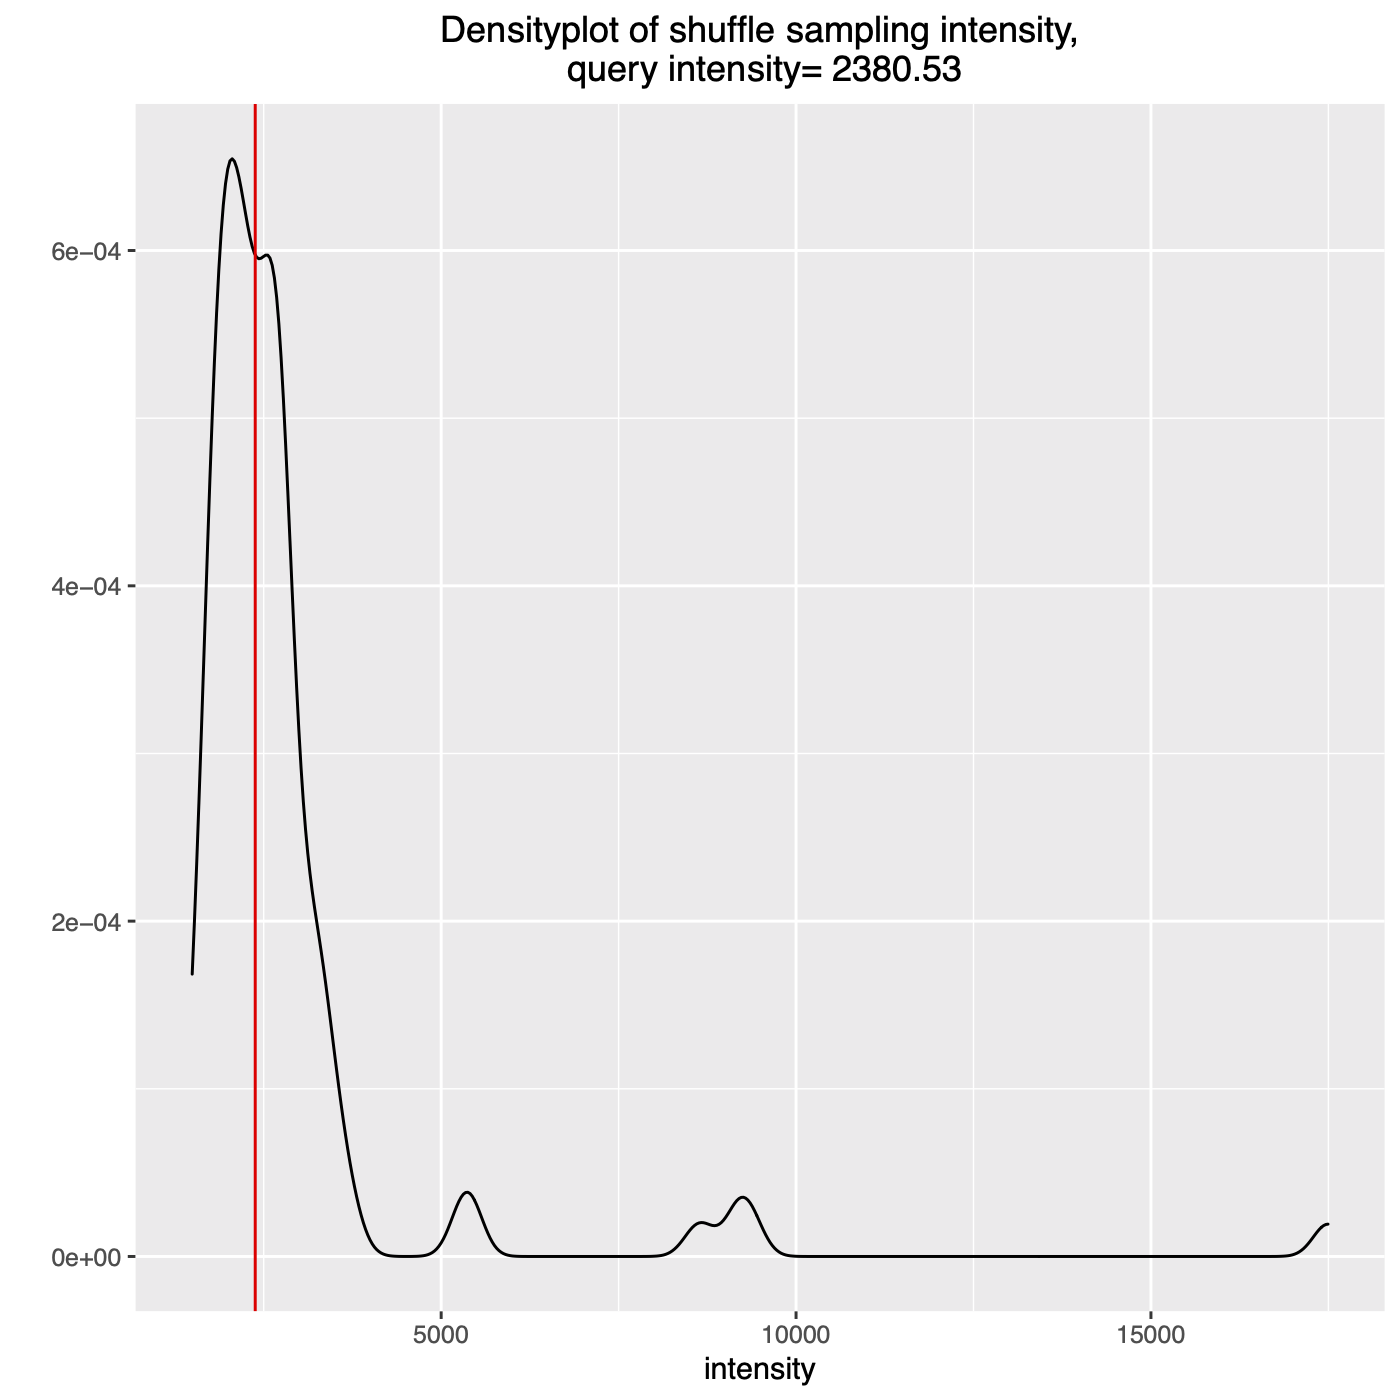
The plot shows density of shuffle test and the query frequency is highlined as a red vertical line.